
Nano Ark lab results:
E. coli and 3 mold species

Two independent lab tests confirming Nano Ark's effect, plus an in-house comparison — published with their conditions, figures and report scans.

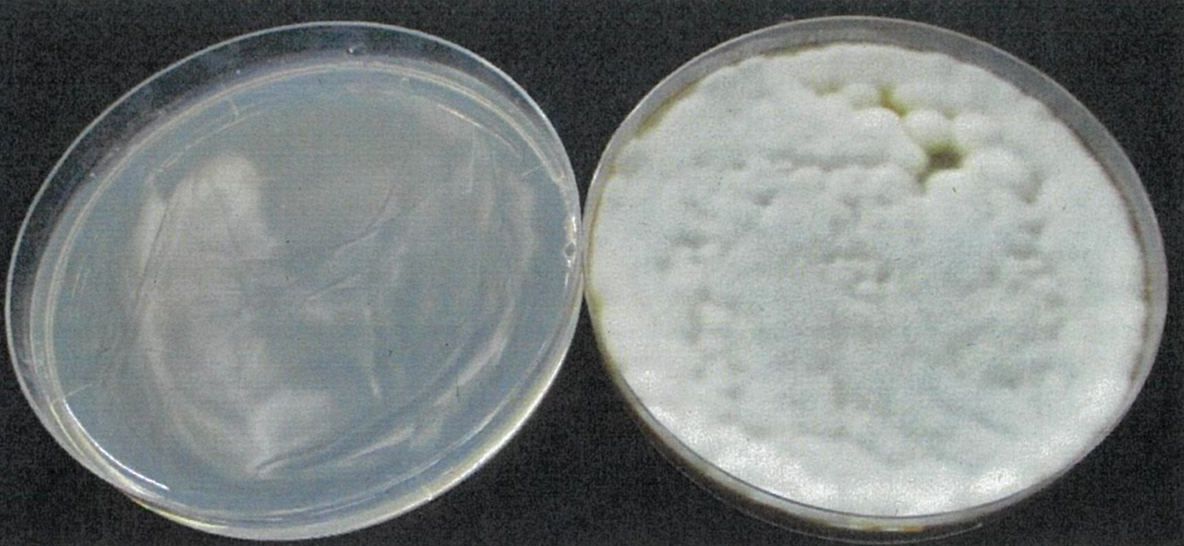
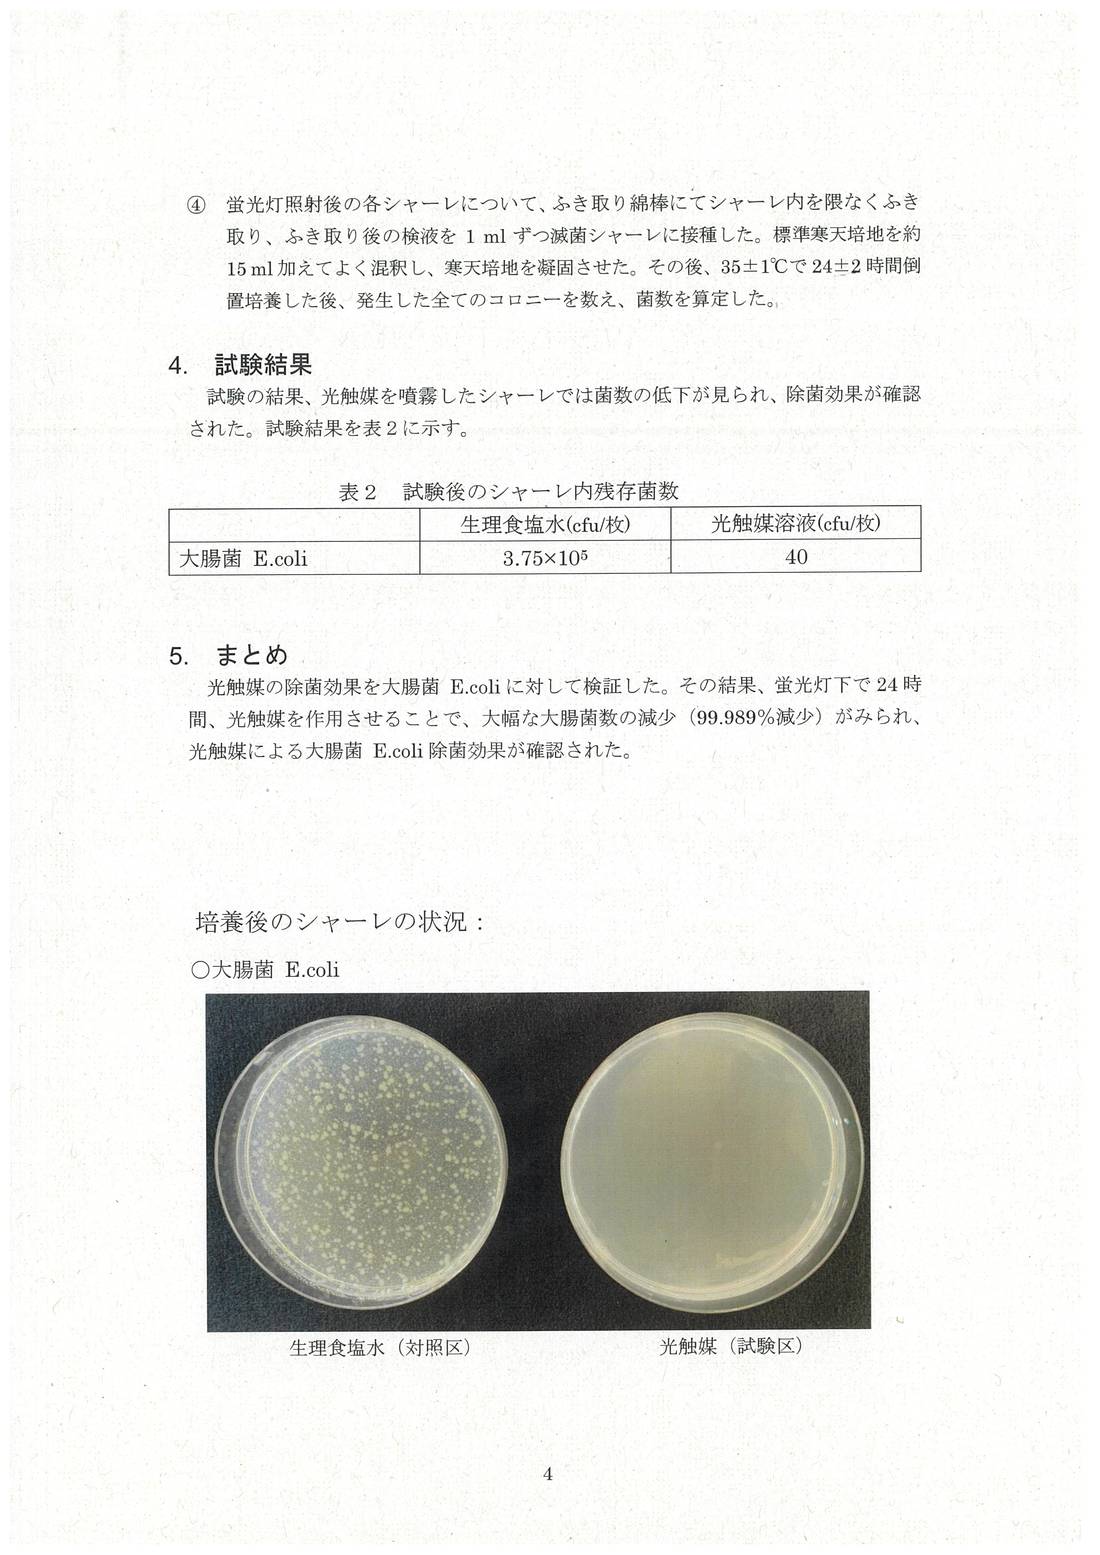
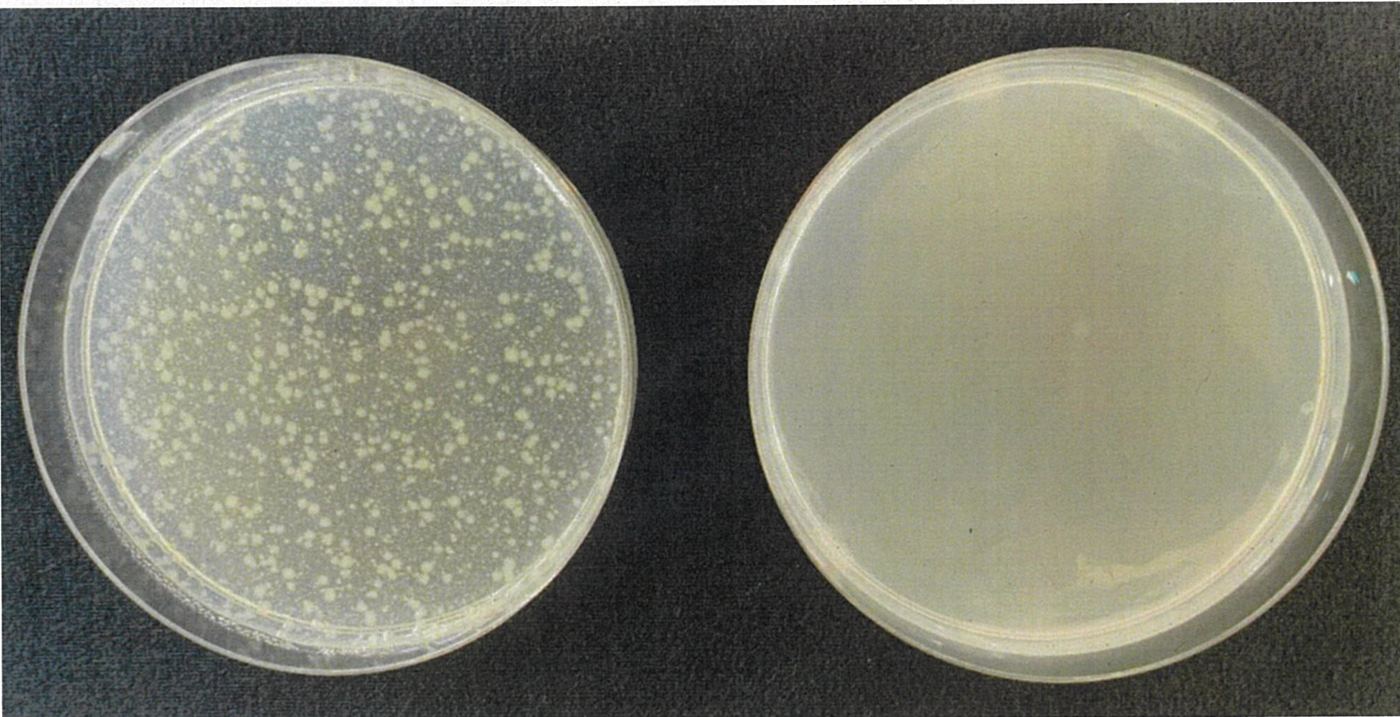
Dishes after incubation: left, saline control with many E. coli colonies; right, Nano Ark with almost none.
Control (saline)Nano Ark

E. coli test

June 2021 | Okinawa Environmental Science Center (一般財団法人 沖縄県環境科学センター)

In a June 2021 test by the Okinawa Environmental Science Center, E. coli on dishes sprayed with the Nano Ark photocatalyst solution fell to 40 cfu/dish after 24 hours under 1,350-lux fluorescent light — a 99.989% reduction compared with the saline control (3.75×10⁵ cfu/dish).

Residual bacteria per dish after the test (cfu/dish)
OrganismControl (saline)Nano Ark
E. coli3.75×10540
99.989%Reduction vs. control (as stated in the report)
Test conditions
Inoculum100 µl of standard E. coli suspension applied with an automatic plater (2.78×10⁶ cells per dish after drying)
TreatmentSprayed with the photocatalyst solution, or with saline (control)
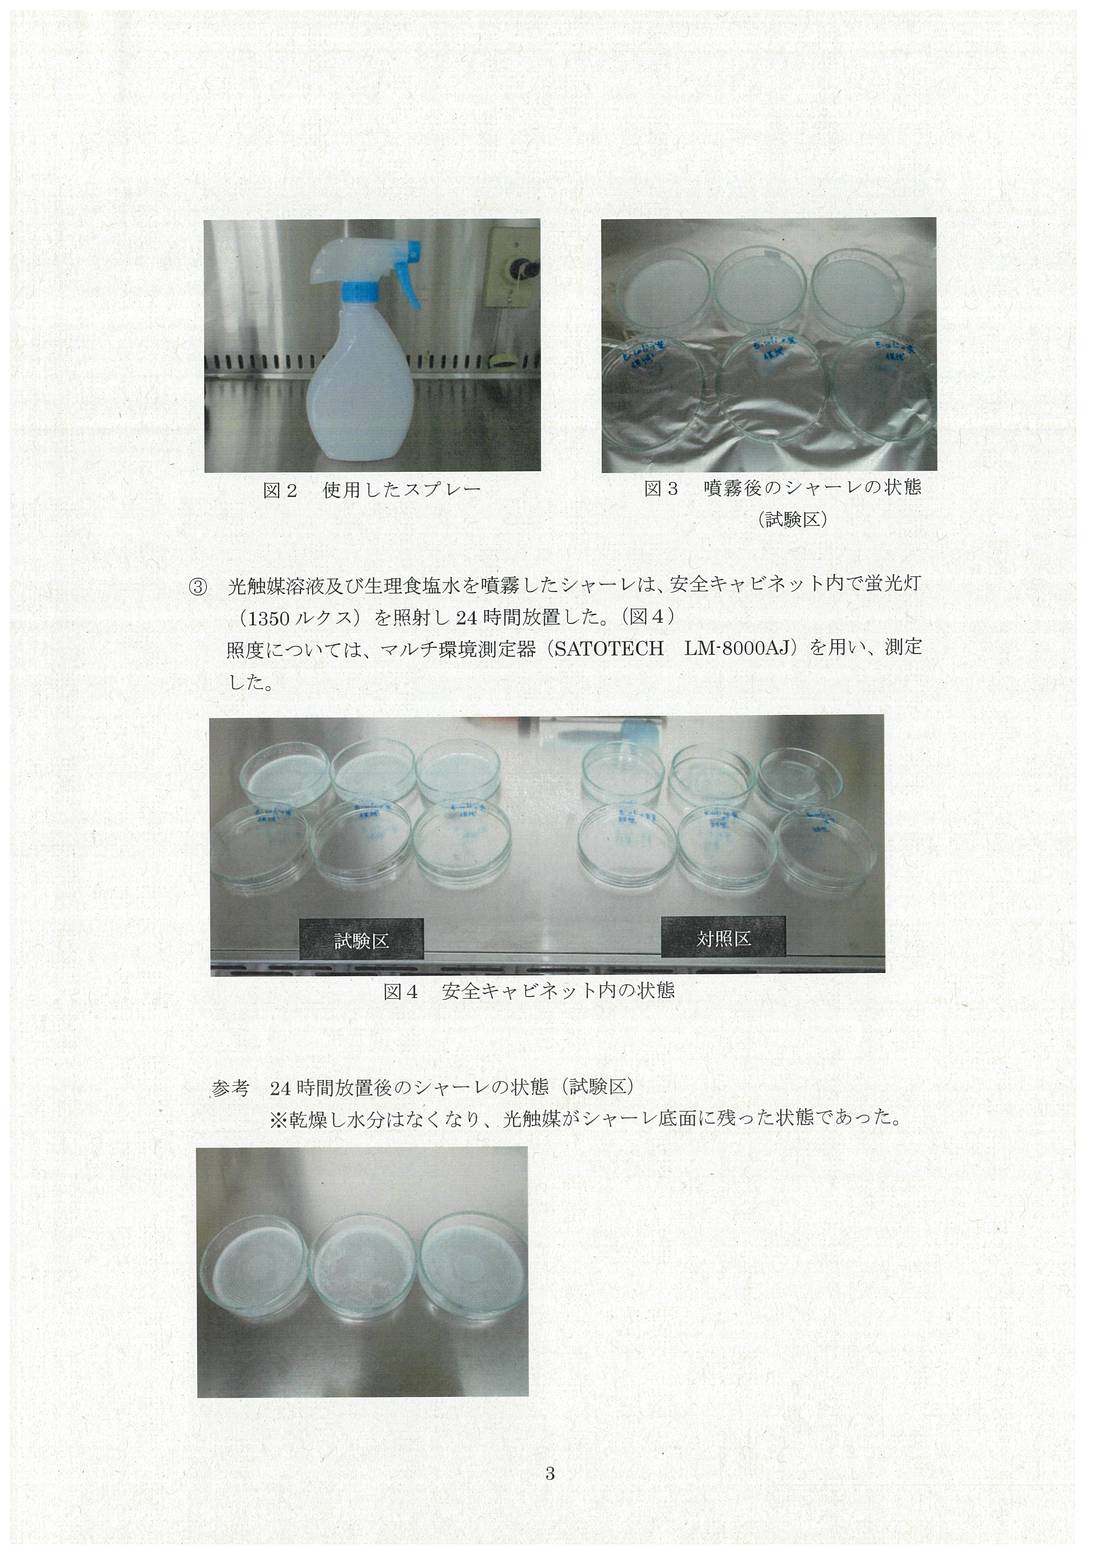
LightFluorescent light, 1,350 lux, 24 hours, inside a safety cabinet
MeasurementSwabbed, cultured on standard agar at 35±1 °C for 24±2 hours, colonies counted
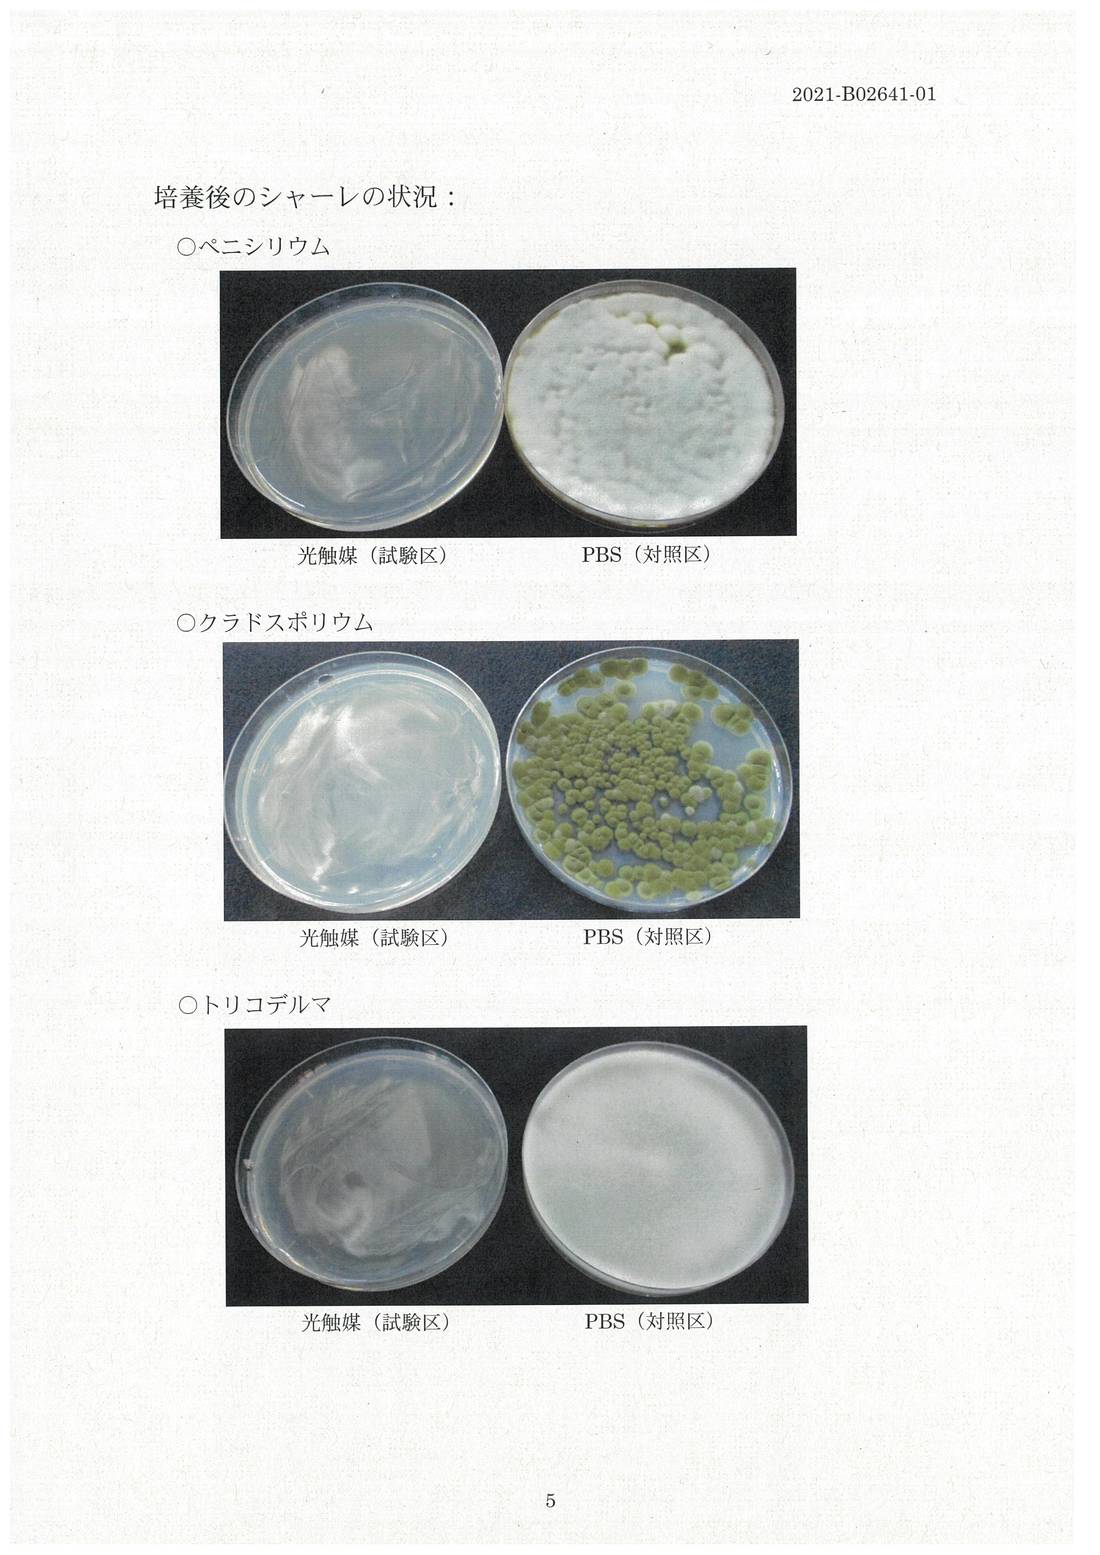
Nano ArkControl (PBS)
PenicilliumPenicillium: left, Nano Ark dish with no mold; right, control covered in mold.
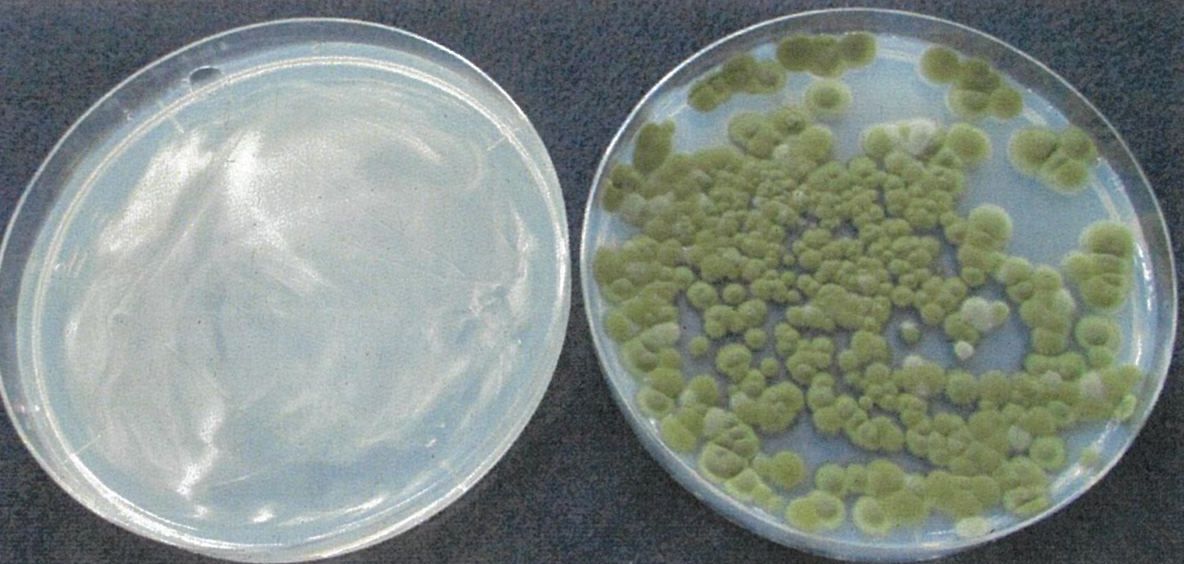
CladosporiumCladosporium: left, Nano Ark dish with no mold; right, control with many green colonies.
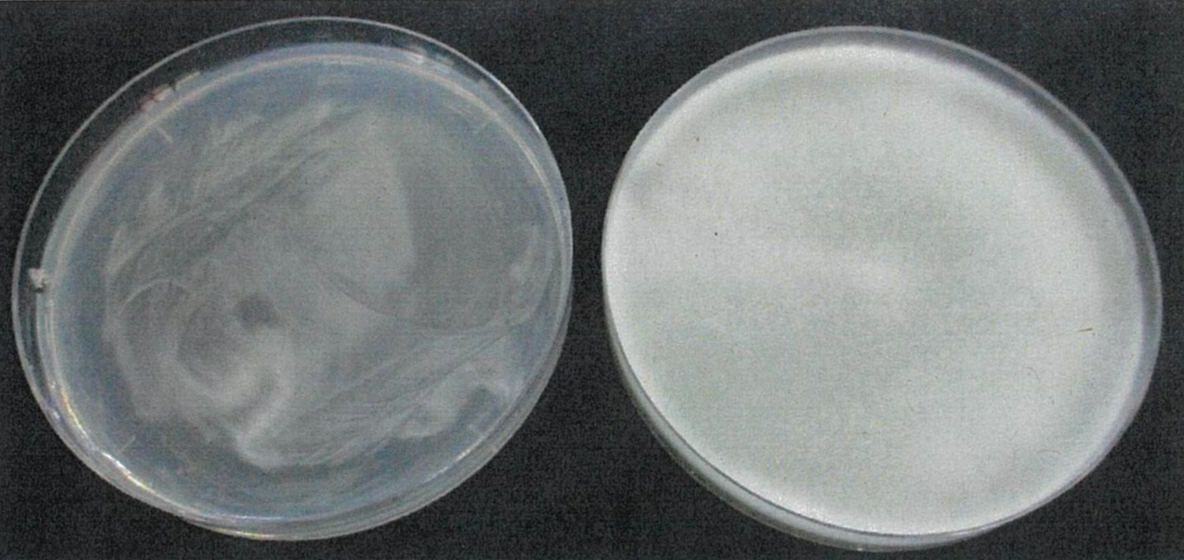
TrichodermaTrichoderma: left, Nano Ark dish with no mold; right, control fully covered.

Mold test — 3 species

May 2022 | Report no. 2021-B-02641-01 | Okinawa Environmental Science Center

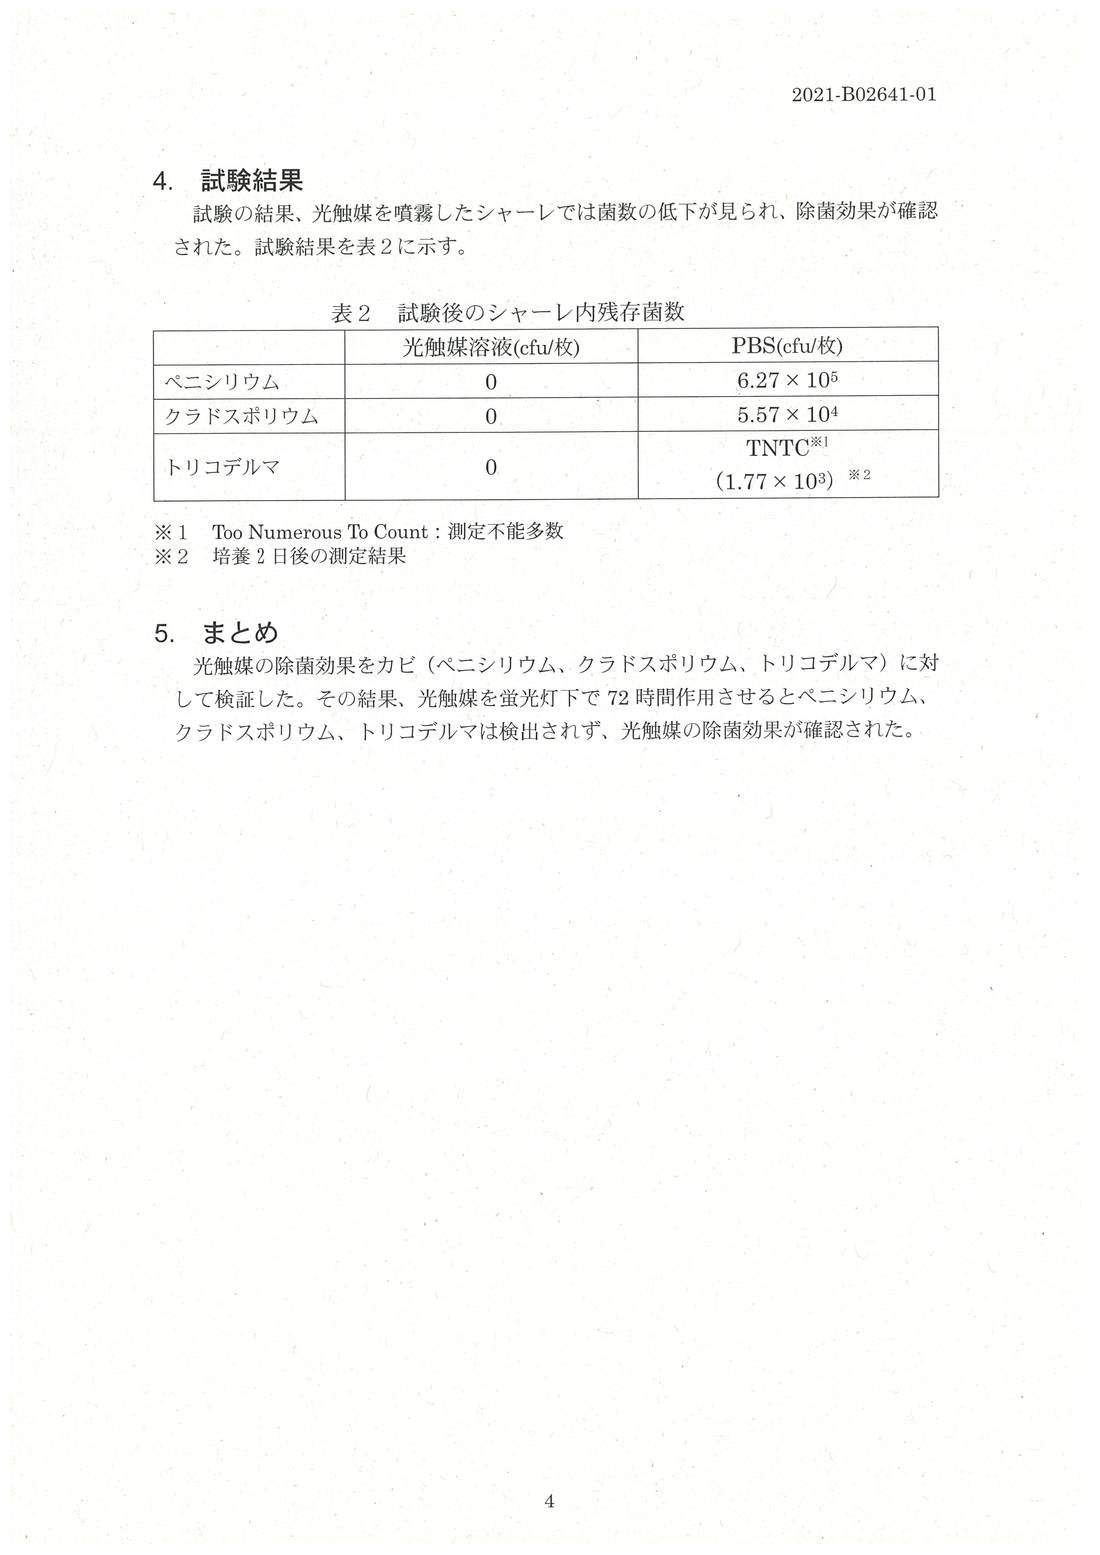
In a May 2022 test by the Okinawa Environmental Science Center (report no. 2021-B-02641-01), Penicillium, Cladosporium and Trichoderma were not detected on dishes sprayed with the Nano Ark photocatalyst solution after 72 hours under fluorescent light, versus 6.27×10⁵, 5.57×10⁴ and too-numerous-to-count cfu/dish on the PBS control.

Residual mold per dish after the test (cfu/dish)
SpeciesControl (PBS)Nano Ark
Penicillium6.27×1050
Cladosporium5.57×1040
TrichodermaTNTC*0
None detected72 hours under fluorescent light

* Too Numerous To Count. Measured at 1.77×10³ after 2 days of incubation.

* Both are laboratory results under test conditions. Results may differ in real installations (lighting, humidity, surface condition); the effect is not guaranteed.

* The Okinawa Environmental Science Center performed the tests; it does not certify or endorse products.

Reference: our in-house comparison

6 / 1,410ATP reading after 3 hours (Nano Ark / competing product, RLU)

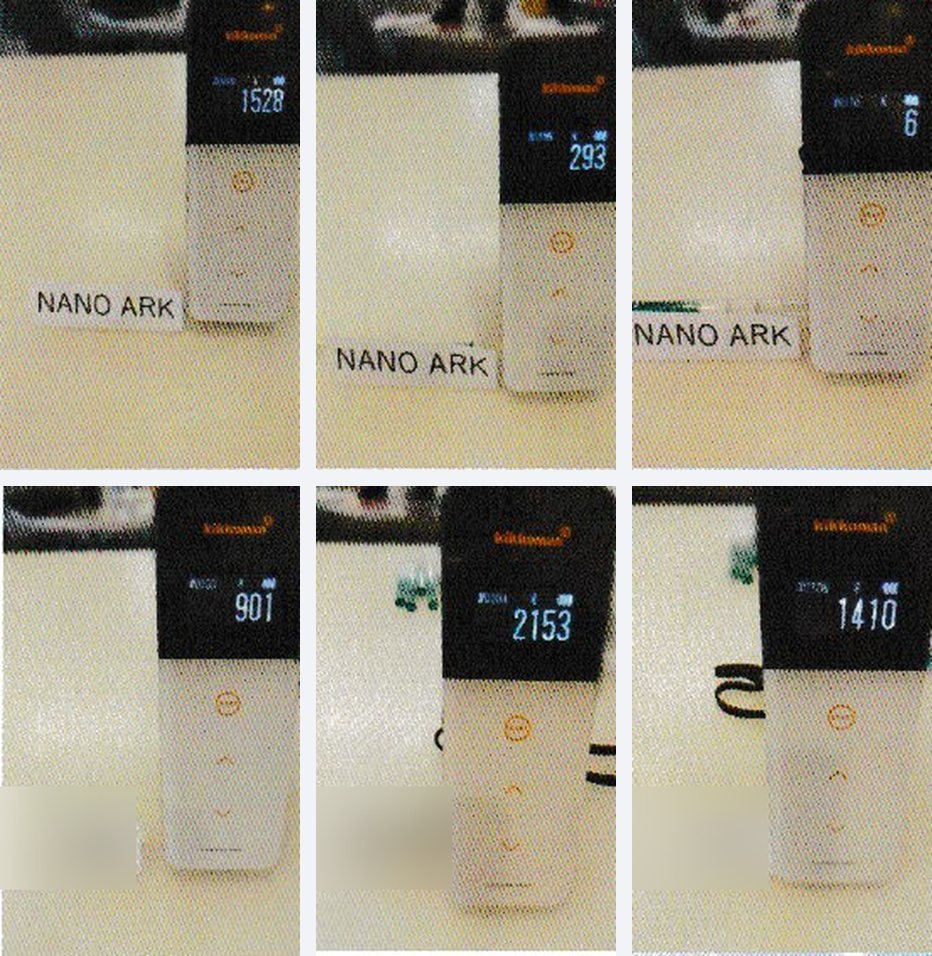
Using ATP swab testing (Lumitester), we compared surfaces treated with Nano Ark and with a competing product. ATP readings indicate the amount of organic contamination, including bacteria.

* An in-house reference test by A-ARK, separate from the Okinawa Environmental Science Center tests.

* The competing product is not named for confidentiality reasons. Values are readings at each time point; results vary with conditions. No starting value is recorded for the competing product, so its line starts at 1 hour.

* Starting conditions could not be confirmed as identical, so this does not show that either product is better.

ATP readings (RLU), in-house test
Start1 h2 h3 h
Nano Ark2,7191,5282936
Competing product—9012,1531,410
ATP readings over time (RLU) Nano Ark: 2,719 at start, 1,528 after 1 hour, 293 after 2 hours, 6 after 3 hours. Competing product: 901, 2,153 and 1,410 (no starting value recorded). 3,0002,0001,0000 Start1 h2 h3 h 2,7191,5282936 9012,1531,410 Unit: RLU (Lumitester reading)
Nano ArkCompeting product
Lumitester screens. Top row, Nano Ark: 1528, 293, 6. Bottom row, competing product: 901, 2153, 1410.

Photos taken during measurement. Top row: Nano Ark. Bottom row: the competing product. Nano Ark started at 2,719.

Photos from A-ARK's own materials. The competing product's label is blurred.

What our data covers

We only claim effects that our test data confirms.

Independent test

E. coli and 3 mold species

The Okinawa Environmental Science Center confirmed an E. coli reduction and no detectable mold under fluorescent light.

In-house test

ATP comparison

A reference comparison with a competing product.

No test data

Effect without light

Both independent tests were run under fluorescent light.

No test data

Viruses, odor, durability

We have no test data at present, so we make no claims about these.

Start with a free site survey.

Tell us about your building and the areas that concern you.

Book a free site survey